Top 30 Data Analytics Interview Questions and Answers for Freshers
Interviewers usually want to check your basic understanding of tools, concepts, and how you think about data. The good news is that most interviews follow a common pattern, which means you can prepare well if you know the right questions in advance.


Getting ready for a data analytics interview can feel stressful, especially if you are a fresher or someone changing careers.
Interviewers usually want to check your basic understanding of tools, concepts, and how you think about data. The good news is that most interviews follow a common pattern, which means you can prepare well if you know the right questions in advance. This article covers 30 commonly asked data analytics interview questions, including core concepts and real-world scenario questions, along with simple answers to help you prepare with confidence.
CORE CONCEPTS
What is data analytics?
Data analytics is the process of collecting, cleaning, organizing, and studying data to find useful insights, which help businesses make better decisions. A data analyst works with raw data and turns it into meaningful information.
Why is data analytics important?
Companies use data analytics to understand trends, customer behavior, and business performance. It helps them make informed decisions, improve sales, reduce costs, and solve problems faster.
What is the role of a data analyst?
A data analyst collects data, cleans it, analyzes it, and presents the findings in a simple way, often using tools like Excel, SQL, Python, Power BI, or Tableau. Their job is to help the company understand what the data is saying.
What is the difference between data and information?
Data is raw facts or figures, such as numbers, names, or dates. Once that data is processed and given meaning, it becomes information that can be used for decision-making. In simple words, data becomes information after analysis.
What is data cleaning?
Data cleaning means fixing or removing incorrect, incomplete, duplicate, or inconsistent data. This step matters because bad data can lead to wrong conclusions, while clean data gives more accurate results.
Why do we use Excel in data analytics?
Excel is simple, flexible, and useful for basic analysis. It helps with organizing data, using formulas, creating charts, and building reports. Many beginners start here because it teaches core analytical skills.
What is SQL?
SQL stands for Structured Query Language, and it is used to communicate with databases and retrieve data from them. Data analysts rely on SQL to filter, sort, join, and analyze large datasets.
Why is SQL important for a data analyst?
SQL is important for a data analyst because most company data is stored in databases. It helps organize, summarize, and combine data from multiple tables, making it easier to identify trends and generate meaningful insights.
What is a database?
A database is an organized collection of data stored electronically. It helps users store, manage, search, and access information efficiently. Databases are commonly used in businesses, websites, and applications to handle large amounts of data.
What is the difference between a table and a database?
Think of a database as a complete storage system that can hold many tables. A table, on the other hand, is a smaller part of that system, storing related data in rows and columns, much like a sheet inside a larger storage system.
What is data visualization?
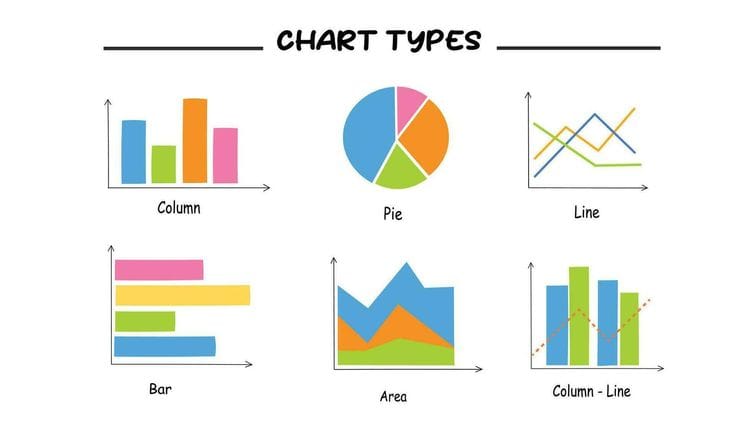
Data visualization is the presentation of data using charts, graphs, dashboards, and other visual formats. It makes complex data easier to understand and helps people notice patterns and trends quickly.
Why is data visualization important?
Data visualization is important because it makes complex data easier to understand by presenting information through charts, graphs, and dashboards. Visuals communicate information more clearly than raw numbers. Managers and clients can understand results faster through charts and dashboards, which makes any analysis more useful.
What tools are used for data visualization?
Common tools include Power BI, Tableau, Excel, and sometimes Python libraries like Matplotlib and Seaborn. Analysts choose between them depending on the project and the company's needs.
What is Python used for in data analytics?
Analysts use Python for data cleaning, analysis, automation, and visualization. It handles large datasets well and supports advanced tasks, especially with libraries like Pandas and Matplotlib.
What is Pandas?
Pandas is a Python library built for working with data. It helps with reading, cleaning, filtering, and analyzing datasets, making it one of the most important libraries for any data analyst.
What is a dataframe?
A dataframe is a table-like structure used in Pandas to store data, with rows and columns like an Excel sheet. Analysts use it to manage and analyze datasets directly in Python.
What are missing values?
Missing values are empty or unavailable data points in a dataset. They can occur for many reasons, such as recording errors or incomplete surveys, and analysts must handle them carefully since they can affect results.
How do you handle missing values?
There are a few common approaches: removing them, filling them with averages, or using other suitable methods depending on the dataset and the type of analysis. The goal is always to reduce errors without losing important information.
What is a KPI?
KPI stands for Key Performance Indicator, a measurable value used to check how well a business or team is performing. Sales growth, customer retention, and website traffic are common examples.
What is the difference between correlation and causation?
Correlation means two things are related, but one does not necessarily cause the other. Causation, however, means one factor directly causes the other. This distinction matters a great deal in data analysis, since correlation alone does not prove cause.
What is a trend in data?
A trend is simply the general direction in which data changes over time. It may increase, decrease, or stay stable, and analysts study trends to understand what is happening within a business.
What is the purpose of a dashboard?
A dashboard brings important data and KPIs together in one place. It gives a quick overview of performance and helps users make decisions faster, which is why managers and business teams rely on it so often.
What is the difference between qualitative and quantitative data?
Qualitative data describes qualities or categories, such as color, gender, or feedback. Quantitative data, by contrast, is numerical and can be measured, such as height, salary, or sales. Both types play a useful role in analytics.
What are joins in SQL?
Joins combine data from two or more tables based on a related column, allowing analysts to work with connected data stored across different tables. Common types include inner join, left join, right join, and full join.
What is the difference between structured and unstructured data?
Structured data is organized in a fixed format, such as rows and columns in a spreadsheet or database, which makes it easy to search and analyze. Unstructured data has no fixed format, such as emails, videos, or social media posts, and usually needs extra processing before it can be analyzed.
Imagine you receive a dataset with several missing values and duplicate rows. What should you do first?
The first step is to understand why the data is missing or duplicated. Exact duplicates should be removed, and missing values can either be filled using a suitable method like the average or median, or dropped if they are too few to affect the analysis. The goal is to clean the data without losing meaningful information.
A manager asks why sales dropped last month but gives no other details. How should this be approached?
The best approach is to pull the sales data and break it down by product, region, and time to see where the drop is coming from. Comparing this month against previous months and the same month last year helps rule out normal seasonal changes. Once a pattern is found, related factors such as marketing spend, stock availability, or pricing changes should be checked before presenting the findings.
Two variables in a dataset are strongly correlated, and a manager wants to use this as proof that one causes the other. How should this be handled?
It should be explained that correlation alone does not prove causation, since other factors could be influencing both variables at the same time. Further analysis, such as controlled comparisons or additional data, should be suggested before making that claim in a report, since presenting it as fact without proof could lead to a wrong business decision.
A large dataset is taking too long to analyze in Excel. What should be done?
Since Excel struggles with very large datasets, the data should be moved into a tool better suited for that scale, such as SQL for storage and querying, or Python with Pandas for analysis. This makes the process faster and allows repetitive steps to be automated instead of done manually.
A dashboard is not being used by the team, even though it contains useful data. What might be the reason, and what should be done?
The dashboard may be too cluttered, hard to understand, or not focused on the metrics the team cares about. The team should be asked directly what decisions they are trying to make, and the dashboard should then be redesigned around those specific needs, kept simple, and focused on the most relevant numbers.
CONCLUSION
Data analytics interviews for freshers usually focus on basic concepts, tools, and problem-solving skills, along with a few practical scenarios to test how candidates think. Understanding topics like Excel, SQL, Python, data cleaning, and visualization, and being able to apply them to real situations, puts a candidate ahead of many beginners. Practicing these questions regularly, and explaining answers in simple language, builds the kind of confidence that helps in performing well during a first interview.