Excel Skills Every Data Analyst Should Know
Excel is still one of the most valuable tools for data analysts, and learning the right skills can make a big difference. If you understand data organization, formulas, conditional logic, PivotTables, charts, and lookup functions, you will be much more effective in your work.


Microsoft Excel is one of the most important tools for data analysis, especially for beginners.
It is simple to use, widely available, and powerful enough to handle many common data tasks. Data analysts use Excel to organize information, clean data, create formulas, and build reports. Even in companies that use advanced tools, Excel remains a daily part of many analytics workflows. This article explains the most important Excel skills every data analyst should know and why they matter.
Data entry and organization
The first skill every data analyst should learn in Excel is how to enter and organize data properly. Data should always be arranged in a clear table with meaningful column names and no empty rows or columns inside the dataset. Good organization makes it easier to sort, filter, and analyze information later.
For example, if you are working with sales data, each row should represent one transaction and each column should represent one piece of information, such as date, product name, city, or amount. When data is structured correctly, analysis becomes much faster and more accurate. Poorly organized data can create confusion and mistakes.
Sorting and filtering
Sorting and filtering are basic but very important Excel skills. Sorting helps you arrange data in ascending or descending order, while filtering helps you show only the records that meet a condition. These tools are useful when you want to focus on specific information.
For example, you may want to sort sales from highest to lowest or filter only records from a particular city. These tasks are simple, but they save time and help you find insights quickly. Every analyst should be comfortable using both tools because they are used in almost every project.
Basic formulas and functions
Formulas and functions are the heart of Excel analysis. They allow you to calculate totals, averages, counts, and other useful values. Without formulas, Excel would only be a storage tool, but with formulas, it becomes a real analysis tool.
Some common functions include SUM, AVERAGE, COUNT, MIN, and MAX. For example, you can calculate the total sales for a month or the average marks of students. Learning formulas helps you do calculations faster and reduces manual work. It also improves accuracy because Excel handles the math for you.
=SUM(B2:B10)
=AVERAGE(B2:B10)
=COUNT(B2:B10)
These formulas calculate the total, average, and count of values in a range.
Relative and absolute cell references
Understanding cell references is very important when using formulas. A relative reference changes when you copy a formula to another cell, while an absolute reference stays fixed. This helps you build more flexible and reusable spreadsheets.
For example, if you are calculating tax or discount for many rows, you may want one value to remain constant while the formula is copied down. Using the $ sign in Excel helps create absolute references.
=A2*$D$1This formula multiplies the value in cell A2 by the fixed value in D1. The $ signs make sure that D1 does not change when the formula is copied.
Conditional Formulas
Conditional formulas help you make decisions based on data. The most common one is the IF function. It allows you to return one value if a condition is true and another value if it is false. This is useful for classification and simple logic-based analysis.
For example, you can label students as "Pass" or "Fail" depending on their marks. Conditional formulas make your analysis more meaningful and useful for reporting.
=IF(B2>=50,"Pass","Fail")This formula checks whether the value in B2 is 50 or higher. If yes, it shows “Pass”; otherwise, it shows “Fail.”
Data Cleaning
Data cleaning is a major part of Excel work. Real datasets often have mistaken, duplicates, missing values, or inconsistent formats. A data analyst must clean the data before performing analysis so that the results are reliable.
In Excel, you can remove duplicates, fix spelling mistakes, format dates, and replace missing values. You can also use text functions to clean extra spaces or split information into separate columns. Clean data leads to better analysis and better decisions.
PivotTables
PivotTables are one of the most powerful Excel features for data analysis. They let you summarize large amounts of data quickly and easily. With a PivotTable, you can group, count, sum, and compare data without writing complex formulas.
For example, if you have sales data for different products and resellers, a PivotTable can summarize total sales by product and reseller while also showing each item’s percentage of total sales. This helps you quickly compare performance and identify sales trends.

Charts and graphs
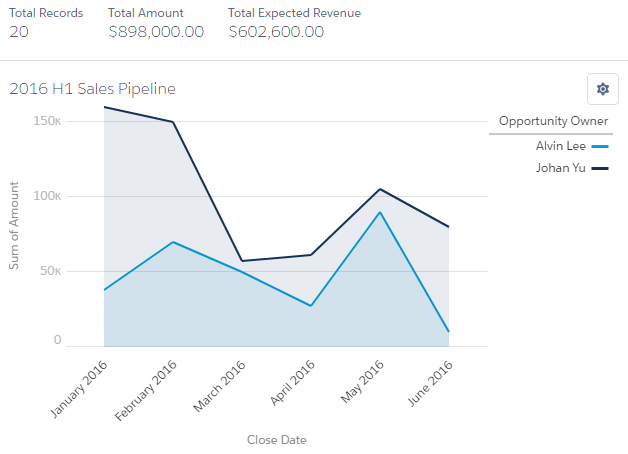
Charts and graphs are important because they turn data into visuals that are easy to understand. Excel offers many chart types, such as bar charts, line charts, pie charts, and column charts. Visuals help you communicate findings more clearly.
For example, if you want to show sales growth over time, a line chart is a good choice. If you want to compare categories, a bar chart works well. Learning how to choose the right chart is an important skill for every analyst.
Data validation
Data validation helps control what users can enter in a spreadsheet. It is useful when you want to prevent wrong or inconsistent data from being entered. For example, you can restrict a cell to accept only numbers, dates, or values from a list.
This feature improves data quality and reduces errors. It is especially useful in forms, reports, and shared spreadsheets. Data validation helps maintain clean and accurate datasets.
Lookup functions
Lookup functions help you find information in a table. One of the most used functions is VLOOKUP, though newer functions like XLOOKUP are also popular. These functions are useful when data is spread across different sheets or tables.
For example, you can use a lookup function to match student IDs with names or product codes with prices. This skill saves time and reduces manual searching. It is especially helpful when working with large datasets.
CONCLUSION
Excel is still one of the most valuable tools for data analysts, and learning the right skills can make a big difference. If you understand data organization, formulas, conditional logic, PivotTables, charts, and lookup functions, you will be much more effective in your work. These skills help you clean data, analyze results, and present insights clearly. For beginners, Excel is an excellent place to start before moving on to SQL, Python, and advanced analytics tools.