Statistics for Data Analytics: Core Concepts You Must Understand
Statistics is the foundation of meaningful data analysis. It helps analysts summarize data, understand variation, study relationships, and test ideas. Concepts like mean, median, standard deviation, correlation, probability, and hypothesis testing are essential for interpreting data correctly.

Statistics is one of the most important parts of data analytics.
It helps analysts understand data, find patterns, and make better decisions based on evidence instead of guesswork. Without statistics, it is difficult to interpret results correctly or explain what the data really means. Many common analysis tasks, such as comparing values, finding relationships, or testing assumptions, depend on statistical concepts. This article explains the core statistics concepts every aspiring data analyst must understand.
Mean
The mean is the average of a set of numbers. It is found by adding all the values and dividing by the number of values. The mean is one of the simplest and most widely used statistical measures.
For example, if five students score 60, 70, 80, 90, and 100, the mean helps you understand the general performance of the group. It gives a quick summary of the data. However, the mean can sometimes be affected by very large or very small values.
Median
The median is the middle value when data is arranged in order. If there is an even number of values, the median is the average of the two middle values. The median is useful because it is less affected by extreme values than the mean.
For example, in a salary dataset, one very high salary can make the mean look much larger than most salaries actually are. In such cases, the median gives a more realistic picture. Data analysts use the median when they want a better sense of the typical value.
Mode
The mode is the value that appears most often in a dataset. A dataset can have one mode, more than one mode, or no mode at all. It is useful when you want to know which value occurs most frequently.
For example, if most customers buy one particular product size, the mode helps identify that pattern. It is especially helpful in categorical data, such as favorite color, product type, or payment method. The mode is simple but useful in many business situations.
Range
The range shows how spread out the data is. It is calculated by subtracting the smallest value from the largest value. A larger range means the data is more spread out.
For example, if one class has marks from 40 to 95, the range is 55. This tells you that the scores vary quite a bit. Range is a basic way to understand variation in data.
Variance
Variance measures how much the data values differ from the mean. If the values are close to the mean, the variance is small. If the values are far from the mean, the variance is large.
Variance is important because it tells you how consistent or inconsistent the data is. For example, two sales teams may have the same average sales, but one team may be much more stable than the other. Variance helps reveal that difference.
Standard Deviation
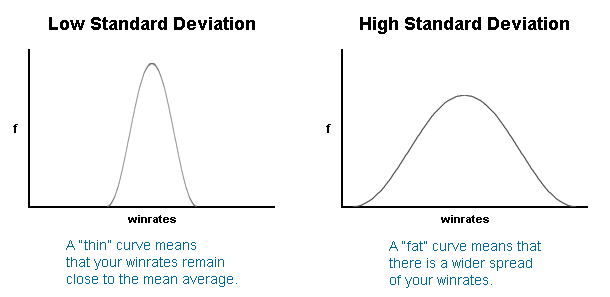
Standard deviation is closely related to variance and tells you how much data values typically differ from the mean. A small standard deviation means the values are close to the average, while a large standard deviation means the values are more spread out.
This measure is very useful in data analytics because it gives a clear idea of data consistency. For example, if monthly sales are almost the same every month, the standard deviation will be low. If sales change a lot, the standard deviation will be high.
Correlation
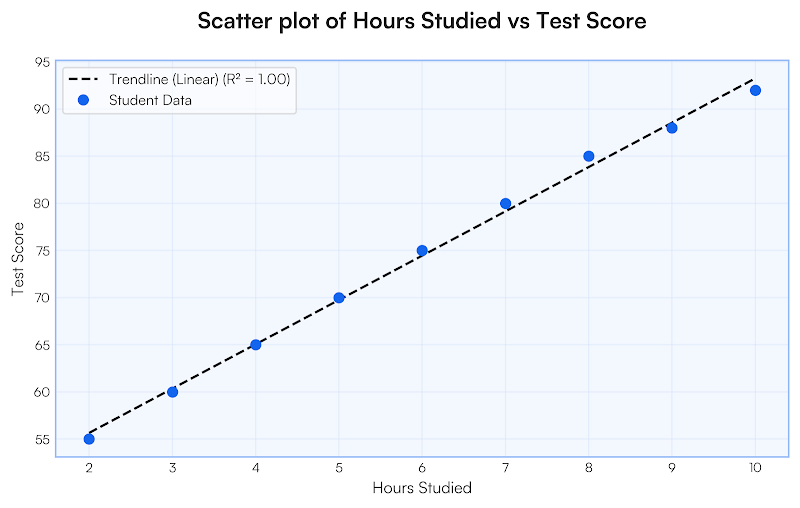
Correlation measures the relationship between two variables. It tells us whether they move in the same direction, in opposite directions, or not at all. A positive correlation means both variables increase or decrease together, while a negative correlation means one increases as the other decreases.
For example, if study time and exam scores rise together, that is a positive correlation. Correlation is useful because it helps analysts discover patterns. However, correlation does not always mean that one thing causes the other.
Causation
Causation means that one factor directly causes another. This is different from correlation, which only shows a relationship. Many beginners confuse the two, but they are not the same.
For example, if sales increase after a promotion, the promotion may have caused the increase. But if two things happen together, that does not always mean one caused the other. Data analysts must be careful not to make false conclusions from correlation alone.
Probability
Probability measures how likely something is to happen. It is usually written as a number between 0 and 1, or as a percentage. In data analytics, probability helps analysts make predictions and understand uncertainty.
For example, if there is a 70% chance of rain, that means the event is likely but not certain. Probability is widely used in forecasting, decision-making, and risk analysis. It helps businesses plan for possible outcomes.
Sampling
Sampling means selecting a smaller group from a larger population to study it. This is useful because studying every single item in a large population can take too much time and effort. A good sample should represent the full population fairly.
For example, a company may survey 500 customers instead of all customers. If the sample is selected properly, the results can still provide a useful picture of the whole group. Sampling is an important part of research and analytics.
Hypothesis Testing
Hypothesis testing is a method used to check whether a claim about data is likely to be true. It helps analysts compare evidence and make decisions based on results. A hypothesis is simply an assumption that can be tested.
For example, a company may want to know whether a new marketing campaign improved sales. Hypothesis testing helps determine whether the result is meaningful or happened by chance. It is one of the most useful statistical methods in business analysis.
Confidence intervals
A confidence interval gives a range of values where the true value is likely to fall. It helps show uncertainty in estimates. Instead of giving only one number, a confidence interval gives a more realistic picture.
For example, if a survey estimates average customer satisfaction, the confidence interval shows the possible range around that estimate. This helps analysts understand how reliable the result is. Confidence intervals are often used with sample data.
CONCLUSION
Statistics is the foundation of meaningful data analysis. It helps analysts summarize data, understand variation, study relationships, and test ideas. Concepts like mean, median, standard deviation, correlation, probability, and hypothesis testing are essential for interpreting data correctly. If you understand these basics, you will be able to analyze information more confidently and make better decisions. For beginners, learning statistics is a major step toward becoming a strong data analyst.