Python for Data Analytics
Python is a beginner-friendly and powerful tool for data analytics. If you learn the basics first, then move to NumPy, Pandas, data cleaning, analysis, and visualization, you will build a strong foundation.


Python is one of the most useful programming languages for data analytics.
It is simple to read, easy to learn, and powerful enough to handle tasks like data cleaning, analysis, and visualization. Many companies use Python because it helps analysts work faster and more accurately with large datasets. For beginners, Python is a great language to start with because it builds both programming confidence and analytical thinking. This article explains a beginner-friendly path to learning Python for data analytics in a clear and practical way. Python courses for beginners commonly start with setup, basic syntax, and then move into libraries like NumPy, Pandas, and Matplotlib for real analysis work.
Start with Python basics
The first step is to learn the basic syntax of Python. This includes understanding variables, data types, strings, lists, dictionaries, loops, and functions. These are the building blocks of the language, and without them, it is difficult to move forward. Beginners should focus on writing small programs first so they can understand how Python works step by step.
For example, you can start with simple tasks like storing a name in a variable, adding numbers, or printing a message. These exercises help you become familiar with Python’s structure and logic. Once you understand the basics, you will find it much easier to work with data analysis libraries later.
name = "Sadikshya"
age = 20
print(name)
print(age)
This code stores values in variables and prints them. It is a simple example, but it shows how Python handles data. Learning these basics first gives you a strong foundation for later analysis tasks.
Learn how to use Jupyter Notebook
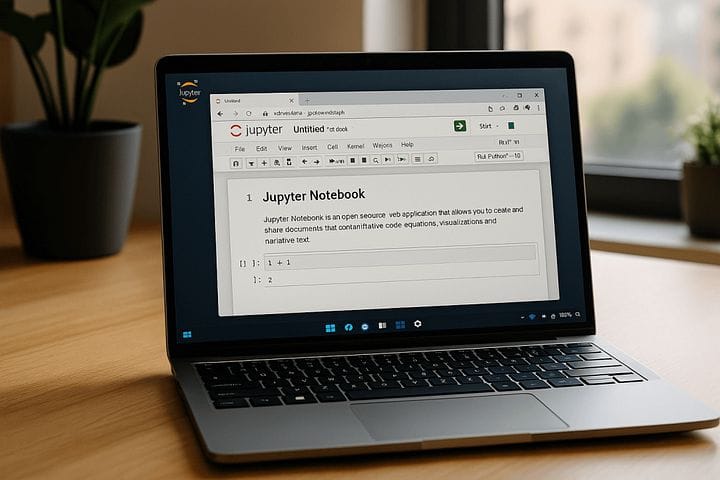
After learning the basics, the next step is to work in Jupyter Notebook or a similar interactive environment. Jupyter Notebook is popular in data analytics because it lets you write code, run it in small parts, and see results immediately. This makes it easier to test ideas and understand your analysis step by step.
For beginners, Jupyter Notebook is helpful because it feels less overwhelming than writing one large program. You can write code in separate cells, add notes in between, and keep your work organized. Many Python learning paths for data analysis use Jupyter Notebook early because it supports hands-on practice and project work.
Understand NumPy
NumPy is one of the first libraries you should learn after Python basics. It is used for numerical computing and makes it easier to work with arrays and mathematical operations. In data analytics, NumPy is useful because it helps process large amounts of numerical data efficiently.
For example, if you want to calculate averages, work with lists of numbers, or perform mathematical operations on data, NumPy can make the job faster. It is especially helpful when working with datasets that contain many values. Learning NumPy gives you a better understanding of how Python handles data at a deeper level.
import numpy as np

numbers = np.array([10, 20, 30, 40])
print(numbers)
print(numbers.mean())
This code creates an array and calculates the average. It shows how NumPy can be used for numerical analysis in a simple way. Although NumPy is not always used by itself in daily reporting, it supports many other data analysis tasks in Python.
Learn Pandas for data handling
Pandas is the most important library for data analytics in Python. It is used to load, clean, filter, and analyze tabular data. If you think of Excel in Python form, Pandas is very close to that idea. It is one of the most widely used tools for analysts because it makes data manipulation much easier.
With Pandas, you can read CSV files, inspect columns, handle missing values, sort data, and create summary tables. It is especially useful when working with real datasets that need cleaning before analysis. Beginners should spend a lot of time practicing Pandas because most data analysis work starts there.
import pandas as pd

data = {
    "Name": ["Asha", "Ravi", "Mina"],
    "Marks": [85, 92, 78]
}

df = pd.DataFrame(data)
print(df)
This code creates a simple dataframe. A dataframe is like a table with rows and columns, and it is the main data structure in Pandas. Once you understand dataframes, you can move into more advanced analysis with confidence.
Practice data cleaning
Data cleaning is one of the most important parts of Python for data analytics. Real datasets are rarely perfect. They often contain missing values, duplicate rows, incorrect formats, or extra spaces. Before analysis, you need to clean the data so your results are accurate.
Pandas makes data cleaning easier by providing many useful functions. You can remove duplicates, fill missing values, rename columns, and convert data types. Learning data cleaning is important because even the best analysis can be wrong if the data is messy.
import pandas as pd

df = pd.DataFrame({
    "Name": ["Asha", "Ravi", None],
    "Marks": [85, None, 78]
})

print(df.isnull())
This code checks for missing values. After identifying them, you can decide whether to remove or replace them. Data cleaning is a practical skill that every analyst uses regularly in real work.
Learn to analyze data with Pandas
Once the data is clean, the next step is analysis. Pandas allows you to calculate summaries, group data, and discover patterns. You can use it to answer business questions such as average sales, total customers, or top-performing categories.
This stage is where data becomes useful. Instead of just storing information, you begin to understand what it means. For example, if one product category is generating more sales than another, that insight can guide business decisions. Pandas makes this kind of analysis simple and effective.
import pandas as pd

df = pd.DataFrame({
    "City": ["Kathmandu", "Kathmandu", "Pokhara", "Dharan"],
    "Sales": [200, 150, 300, 250]
})

print(df.groupby("City")["Sales"].sum())
This code groups sales by city and finds the total sales in each location. Grouping is one of the most common tasks in analytics. It helps turn raw data into useful summaries that are easy to understand.
Create charts with Matplotlib and Seaborn
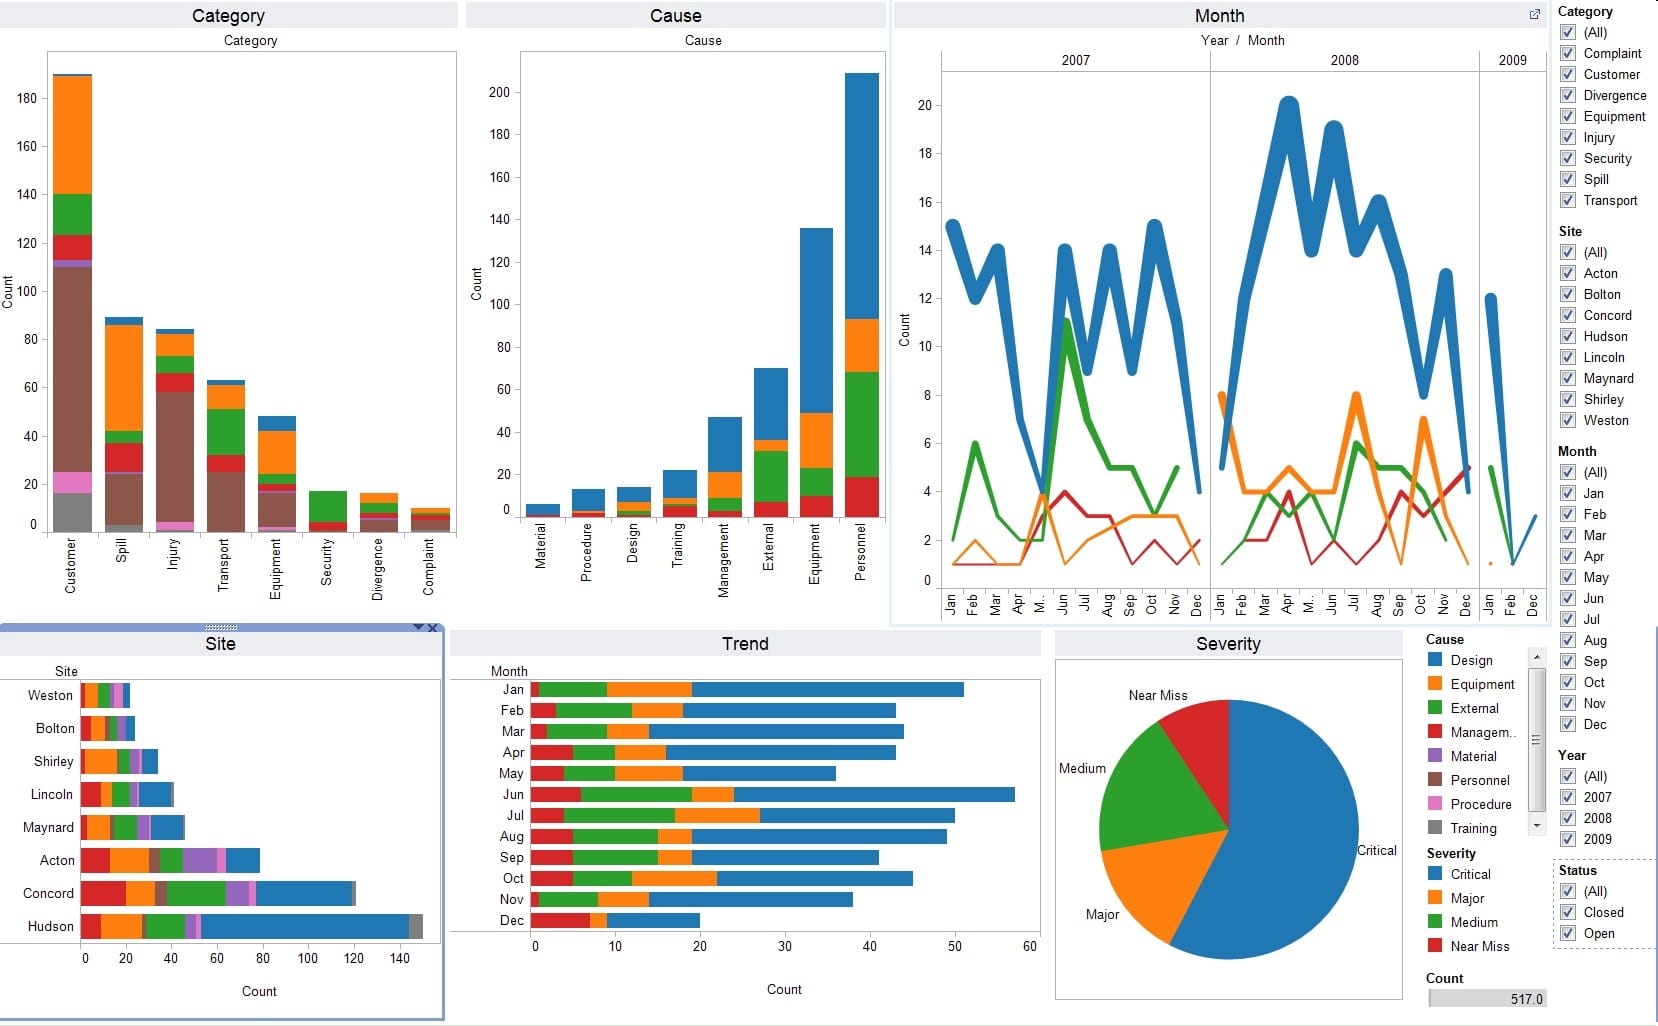
After analysis, you should learn to visualize your results. Matplotlib and Seaborn are popular Python libraries for creating charts and graphs. Visualization is important because it helps people understand data quickly. A clear chart can explain a trend better than a long table of numbers.
For beginners, Matplotlib is a good place to start because it teaches the basics of plotting. Seaborn is also useful because it creates more attractive charts with less code. These libraries help you present your findings in a simple and professional way.
import matplotlib.pyplot as plt

cities = ["Kathmandu", "Pokhara", "Dharan"]
sales = [350, 300, 250]

plt.bar(cities, sales)
plt.title("Sales by City")
plt.xlabel("City")
plt.ylabel("Sales")
plt.show()
This code creates a bar chart. It shows how simple it is to visualize data in Python. Charts like this are very useful in reports, dashboards, and presentations.
Work on real projects
The final step in learning Python for data analytics is to apply your knowledge in real projects. Projects help you practice everything at once: Python basics, Pandas, data cleaning, analysis, and visualization. They also help you build a portfolio that you can show to employers.
You can start with small projects such as analyzing student marks, monthly expenses, sales data, or survey results. As you improve, try working with public datasets and creating more detailed reports. Real projects give you confidence and show that you can use Python to solve real problems. Many beginner roadmaps recommend ending with a project because practical work connects all the earlier steps together.
CONCLUSION
Python is a beginner-friendly and powerful tool for data analytics. If you learn the basics first, then move to NumPy, Pandas, data cleaning, analysis, and visualization, you will build a strong foundation. The most important part is to practice regularly and apply what you learn in real projects. With consistency, Python can help you become a confident and job-ready data analyst. A structured learning path is one of the best ways to grow from beginner to skilled analyst.