Power BI for Beginners: Complete Guide for Aspiring Data Analysts
Power BI is a powerful and beginner-friendly tool for data analysis. It helps users connect data, clean it, model it, and turn it into interactive dashboards. If you learn the basic steps and practice with real datasets, you can build strong reporting skills.


Power BI is one of the most popular business intelligence tools used for data analysis and reporting.
It helps users connect to data, clean it, create visualizations, and build interactive dashboards. For beginners, Power BI is a great tool because it combines simplicity with powerful features that are useful in real business work. It is especially valuable for aspiring data analysts who want to present data in a clear and professional way. This article explains the basic Power BI workflow and the core skills every beginner should understand.
Understanding what Power BI is
Power BI is a Microsoft tool used for data visualization and business reporting. It allows users to turn raw data into charts, tables, and dashboards that are easy to read. Instead of looking at long lists of numbers, people can use Power BI to quickly understand trends and performance.
This tool is widely used in companies because it helps teams make better decisions. Power BI can connect to many different data sources, which makes it very flexible. For beginners, learning Power BI is a strong step toward becoming job-ready in data analytics.
Connecting data sources
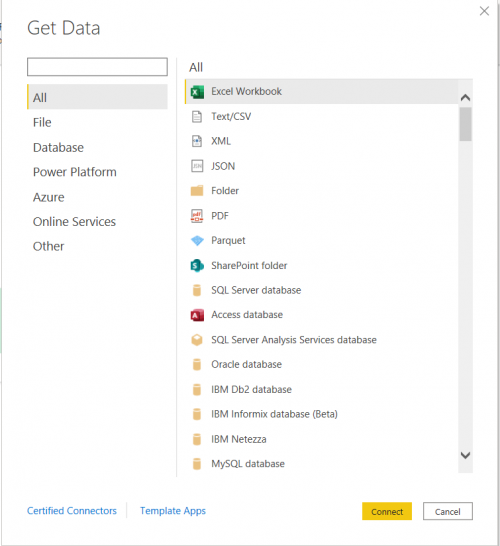
The first step in Power BI is connecting your data source. Power BI can work with Excel files, CSV files, SQL databases, web data, and more. Once the data is connected, you can begin preparing it for analysis.
For example, if you have a sales dataset in Excel, you can import it into Power BI and begin building reports. This step is important because everything in Power BI starts with data connection. If the data source is connected properly, the rest of the work becomes easier.
Cleaning data with Power Query
Power Query is the part of Power BI used for cleaning and transforming data. It helps you remove duplicates, change data types, rename columns, split data, and fix mistakes. Clean data is essential because poor-quality data can lead to wrong insights.
For example, if one column contains dates in the wrong format, Power Query can help correct them. If there are unnecessary columns, they can be removed before building the report. This step makes the dataset ready for analysis and improves accuracy.
Building data models
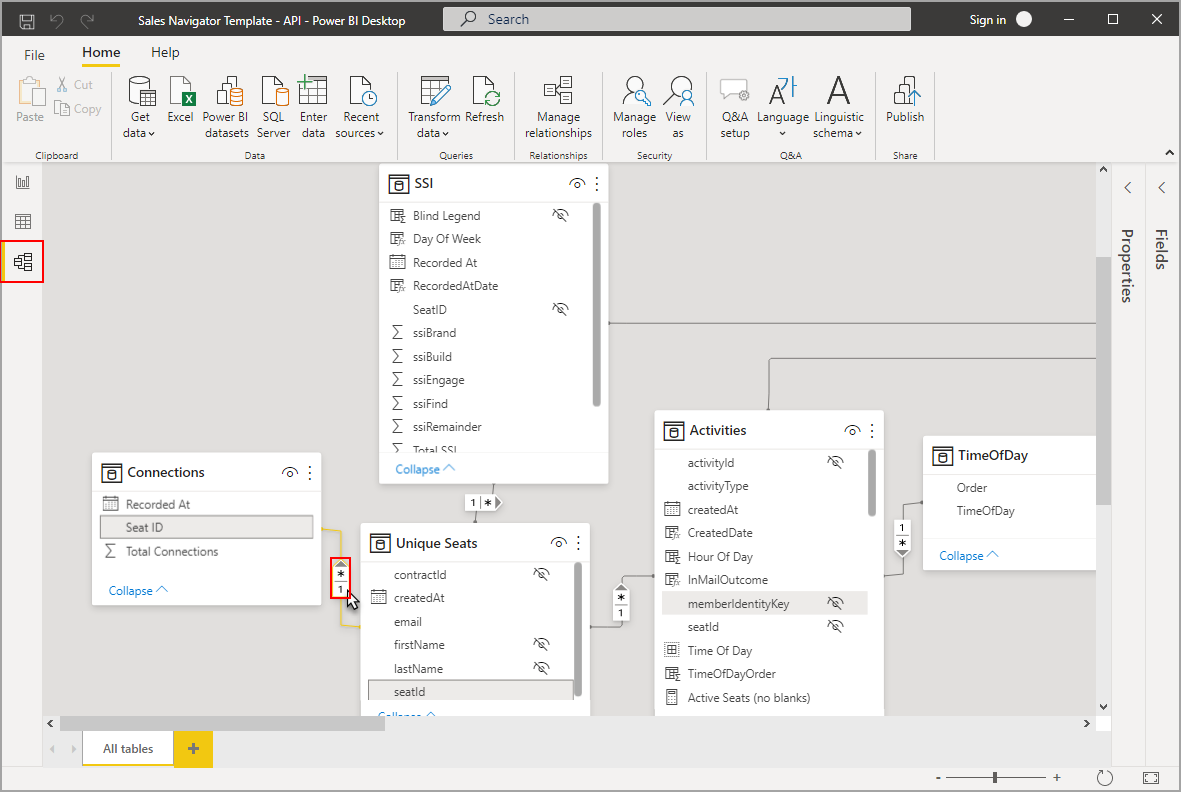
A data model is the way tables are connected inside Power BI. In many cases, data is stored in multiple tables, such as sales, customers, and products. Power BI lets you create relationships between these tables so they work together.
For example, if a sales table and a customer table share a Customer ID, Power BI can link them. This makes it easier to analyze data across different categories. A good data model helps reports work correctly and efficiently.
Creating measures and basic calculations
Power BI uses DAX formulas to create calculations and measures. Measures are used to calculate values like total sales, average profit, or customer count. These calculations are a major part of building useful dashboards.
For example, instead of manually calculating totals outside the tool, you can create a measure directly in Power BI. This makes your reports dynamic because the values update automatically when filters change. Learning basic DAX is very useful for beginners.
Using visualizations
Visualizations are the charts and graphs that display your data. Power BI offers many types of visuals, such as bar charts, line charts, pie charts, cards, and tables. These visuals help users see patterns and understand the data more quickly.
For example, a line chart can show sales trends over time, while a bar chart can compare sales across regions. Choosing the right visual is important because it affects how clearly the message is communicated. Good visuals make reports easier to read and more professional.
Adding filters and slicers
Filters and slicers make reports interactive. They allow users to focus on specific data, such as one region, one product category, or one time period. This feature makes dashboards more useful because users can explore the data themselves.
For example, if a manager wants to see sales only for a particular city, a slicer can make that possible with one click. Interactivity is one of the biggest strengths of Power BI. It helps turn a simple report into a powerful decision-making tool.
Designing a clean dashboard
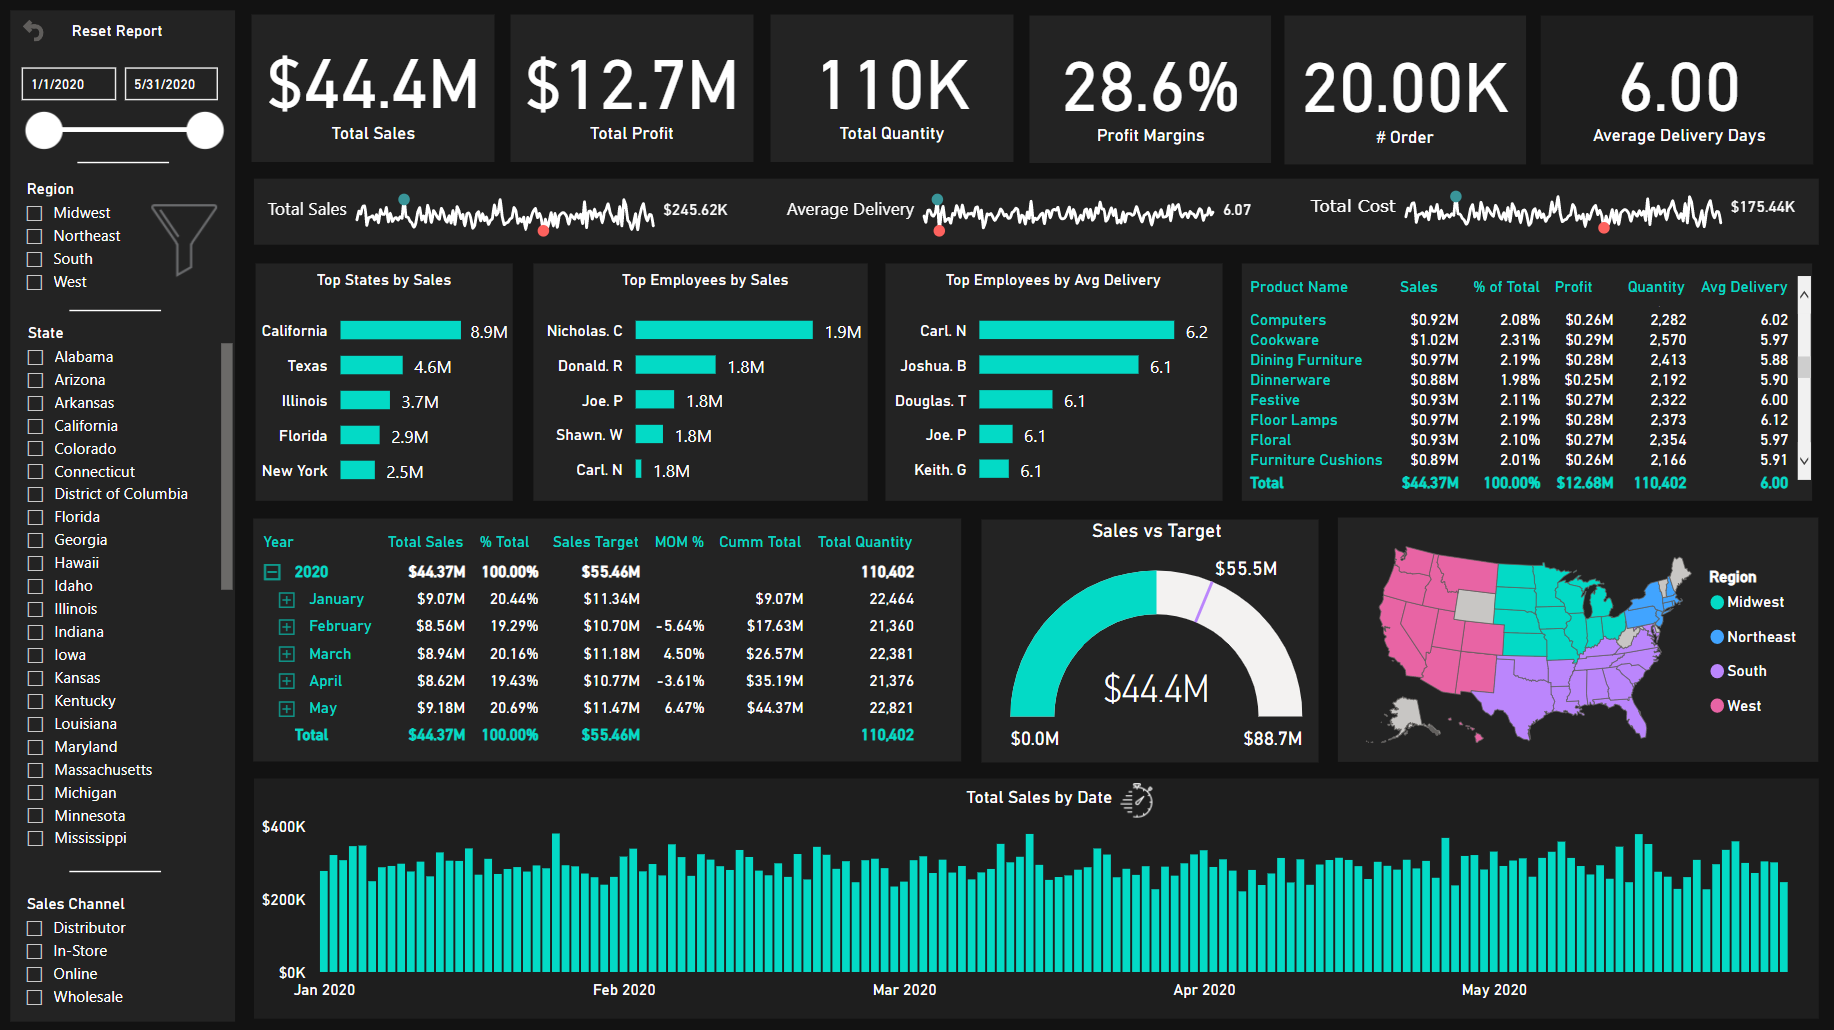
A good dashboard should be easy to understand and visually balanced. The design should not feel crowded or confusing. Important numbers should be easy to see, and charts should be arranged in a logical order.
For example, summary cards can be placed at the top, followed by charts and detailed tables below. Using consistent colors and clear labels improves readability. A clean design helps users focus on the data instead of the layout.
Publishing and sharing reports
After building the report, you can publish it so others can view it online. Power BI makes it possible to share dashboards with teams and managers. This is useful when many people need access to the same data.
For example, a sales report can be shared with a manager so they can review performance anytime. Publishing makes your work more practical and collaborative. It is one of the final steps in the Power BI workflow.
Practicing with real projects
The best way to learn Power BI is through practice. Beginners should start with small projects such as sales reports, student performance dashboards, or expense tracking reports. Real projects help you understand how all the steps work together.
As you practice more, you will become better at data cleaning, modeling, visualization, and dashboard design. Projects also help you build a portfolio that can be shown to employers. This makes Power BI not only a learning tool but also a career-building skill.
CONCLUSION
Power BI is a powerful and beginner-friendly tool for data analysis. It helps users connect data, clean it, model it, and turn it into interactive dashboards. If you learn the basic steps and practice with real datasets, you can build strong reporting skills. Power BI is an excellent tool for aspiring data analysts who want to create clear and useful insights. For beginners, it is one of the best tools to learn after Excel and SQL.