Common Mistakes Beginners Make in Data Analytics (And How to Fix Them)
One common mistake is learning Excel, SQL, or Python before understanding what data analysis is actually trying to solve. Beginners sometimes rush into tools because they seem exciting, but this can create confusion later.


Starting a career in data analytics can be exciting, but beginners often make a few common mistakes along the way.
These mistakes usually happen because the field has many tools, concepts, and skills to learn at once. The good news is that most of these problems can be avoided with the right approach and practice. If you understand the most common mistakes early, you can save time and improve faster. This article explains the biggest beginner mistakes in data analytics and how to fix them step by step. Common beginner issues often include jumping into tools too quickly, skipping data cleaning, and focusing on visuals before understanding the problem.
Starting with tools before understanding the problem
One common mistake is learning Excel, SQL, or Python before understanding what data analysis is actually trying to solve. Beginners sometimes rush into tools because they seem exciting, but this can create confusion later. If you do not understand the problem, the tools alone will not help you much.
The fix is simple: always start with the business question or analysis goal. Ask what problem needs to be solved, what data is available, and what answer is expected. When you understand the purpose first, the tools become much easier to use.
Ignoring data cleaning
Many beginners make the mistake of analyzing messy data without cleaning it first. This can lead to wrong results because missing values, duplicates, and inconsistent entries affect the outcome. In data analytics, poor data quality can ruin even a good analysis.
To fix this, always check your dataset before starting analysis. Remove duplicates, handle missing values, and correct formatting issues. Clean data gives you better insights and makes your work more trustworthy.
Thinking dashboards are the whole analysis
Another mistake is believing that creating a dashboard automatically means the analysis is complete. Dashboards are useful, but they are only one part of the process. A pretty chart without explanation does not show real understanding.
The fix is to go beyond visuals and explain what the data means. Ask what the trend shows, why it matters, and what action should be taken. A strong analyst does not just display data; they interpret it and give useful recommendations.
Not asking enough questions
Beginners often accept the data as it is without asking deeper questions. They may assume the dataset tells the full story, but data usually needs context. Without asking questions, it is easy to miss important details or make weak conclusions.
To improve, always question the source, meaning, and limitations of the data. Ask whether anything is missing, whether the numbers make sense, and whether there could be another explanation. Good analysts stay curious and careful.
Confusing correlation with causation
This is one of the most important beginner mistakes. Correlation means two things change together, but it does not prove that one caused the other. Beginners sometimes see a relationship and immediately assume cause and effect.
The fix is to be careful with conclusions. If two variables move together, you should look for more evidence before saying one caused the other. This habit protects you from making misleading claims in your analysis.
Using the wrong chart
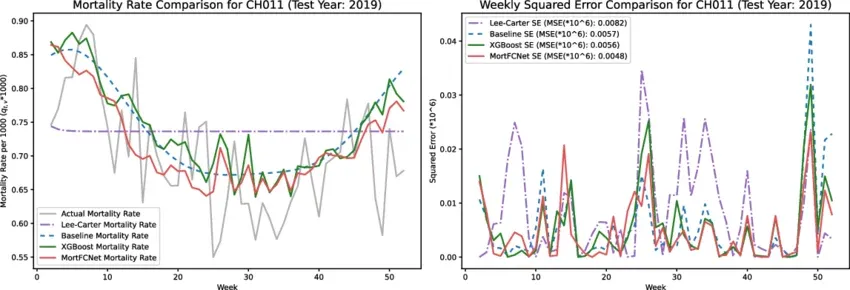
Some beginners choose charts based on appearance instead of meaning. For example, they may use a pie chart when a bar chart would be much clearer. Wrong chart choices can make the data harder to understand.
The fix is to choose the chart based on the message. Use bar charts for comparisons, line charts for trends over time, and scatter plots for relationships. The best chart is the one that communicates the insight most clearly.
Overloading dashboards
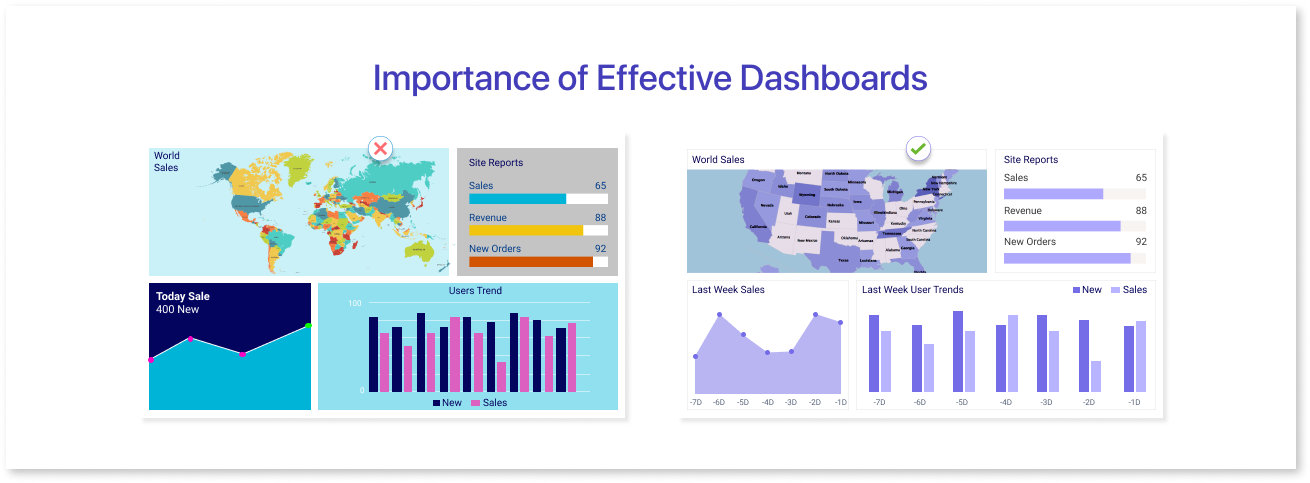
Another common mistake is putting too many charts, colors, and metrics on one dashboard. Beginners often think more visuals make the report better, but too much information can overwhelm the viewer. A crowded dashboard is harder to read and less useful.
The fix is to keep dashboards simple and focused. Show only the most important metrics and use clear layout and spacing. A clean dashboard is usually more effective than a complicated one.
Skipping statistical basics
Some beginners focus only on tools and ignore statistics. This can be a big problem because statistics helps you understand variation, relationships, and uncertainty in data. Without it, your analysis may be shallow or inaccurate.
The fix is to learn basic statistics such as mean, median, standard deviation, correlation, and hypothesis testing. These concepts help you understand what the data is really saying. Even basic statistical knowledge can make your work much stronger.
Not validating results
Many beginners trust the first result they get without checking whether it is correct. This can lead to errors in reports and decisions. If you do not validate your work, small mistakes can go unnoticed.
The fix is to cross-check your findings using another method, another formula, or another dataset if possible. Always review calculations and make sure the output matches the question you asked. Validation builds confidence in your analysis.
Not telling a story with the data
A good analyst does more than present numbers. They explain what happened, why it matters, and what should happen next. Beginners sometimes stop at charts and tables without connecting them to a larger story.
The fix is to structure your analysis like a story: start with the problem, show the data, explain the insight, and end with a recommendation. When you tell a clear story, your analysis becomes more useful to others.
Conclusion
Beginners in data analytics often make mistakes, but those mistakes are part of the learning process. The most important thing is to recognize them early and correct them with good habits. Understand the problem first, clean your data carefully, choose the right visuals, and always explain what your results mean. With practice, these mistakes become learning opportunities that make you a better analyst. If you keep improving step by step, you will build stronger skills and more confidence in your work.