
What is gantt chart and how to make it?
A well-designed Gantt chart should be easy to read at a glance, allowing viewers to understand the project timeline without confusion. Overloading the chart with too many minor tasks can reduce its effectiveness, so maintaining a balance between detail and simplicity is crucial.
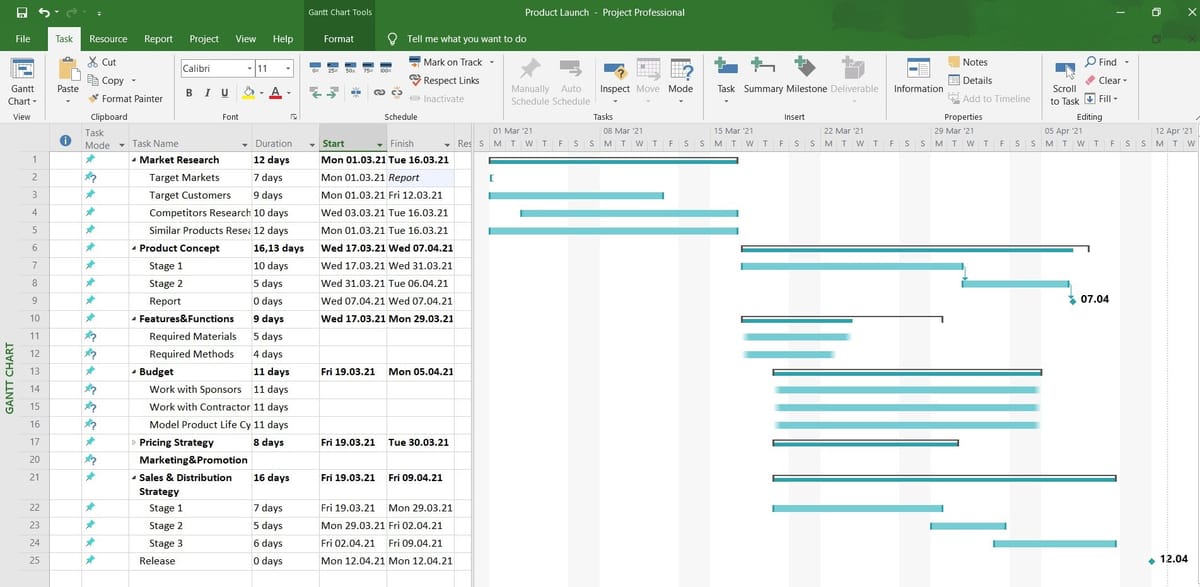
A Gantt chart is a visual project management tool used to plan, schedule, and track tasks over a specific period of time. It provides a clear graphical representation of a project’s timeline by displaying tasks as horizontal bars along a calendar scale. Each bar represents a task, and its position and length indicate the start date, duration, and end date of that task. The concept was popularized in the early twentieth century by Henry Gantt, an American engineer and management consultant who developed the chart as a way to improve industrial efficiency and workflow planning.
Since then, the Gantt chart has become one of the most widely used tools in project management across industries such as construction, software development, manufacturing, education, and event planning. Its simplicity and clarity make it especially valuable for communicating plans to team members, stakeholders, and clients.
At its core, a Gantt chart answers three essential questions: what tasks need to be completed, when they need to be done, and how long they will take. By organizing tasks along a timeline, the chart allows project managers to visualize the sequence of activities and identify overlaps or gaps in scheduling.
This visual format makes it easier to understand the overall structure of a project compared to reading a long list of tasks with dates. It also highlights task dependencies, meaning situations where one task cannot begin until another has been completed. For example, in a website development project, the design phase must typically be completed before the coding phase begins. A Gantt chart clearly shows this relationship, helping teams avoid scheduling conflicts and delays.
One of the main advantages of a Gantt chart is improved planning. Before creating the chart, project managers must break down the project into smaller, manageable tasks. This process, often referred to as task decomposition or work breakdown, ensures that no major component is overlooked. Once tasks are identified, estimating their duration becomes easier.
By mapping these tasks onto a timeline, managers can calculate the overall project length and determine realistic deadlines. The chart also allows for resource allocation, ensuring that team members are not overloaded with multiple tasks at the same time. In this way, a Gantt chart serves not only as a scheduling tool but also as a strategic planning instrument.
In addition to planning, Gantt charts are highly effective for monitoring progress. As work proceeds, completed tasks can be marked, and progress can be compared with the original schedule. If a task takes longer than expected, the delay becomes immediately visible on the chart, allowing managers to adjust subsequent tasks or reassign resources.
This transparency helps reduce uncertainty and keeps everyone informed about the project’s current status. It also encourages accountability, as each team member can clearly see their assigned tasks and deadlines. In large organizations, this visibility improves communication and collaboration between departments.
Creating a Gantt chart involves several systematic steps. The first step is defining the project scope. This means clearly identifying the objectives, deliverables, and overall timeline. Without a clear scope, the chart may become confusing or incomplete. Once the scope is defined, the next step is listing all tasks required to complete the project. These tasks should be specific and measurable. For example, instead of writing “Prepare report,” it is better to break it down into “Collect data,” “Analyze data,” and “Write draft report.” Detailed tasks make scheduling more accurate and manageable.
After listing the tasks, the next step is determining the duration of each task. This requires estimating how long each activity will take based on experience, historical data, or team input. It is important to be realistic during this stage. Overly optimistic estimates can lead to missed deadlines and project stress.
Once durations are determined, the project manager identifies dependencies between tasks. Some tasks can run simultaneously, while others must follow a specific order. Identifying these relationships ensures that the timeline is logical and efficient.
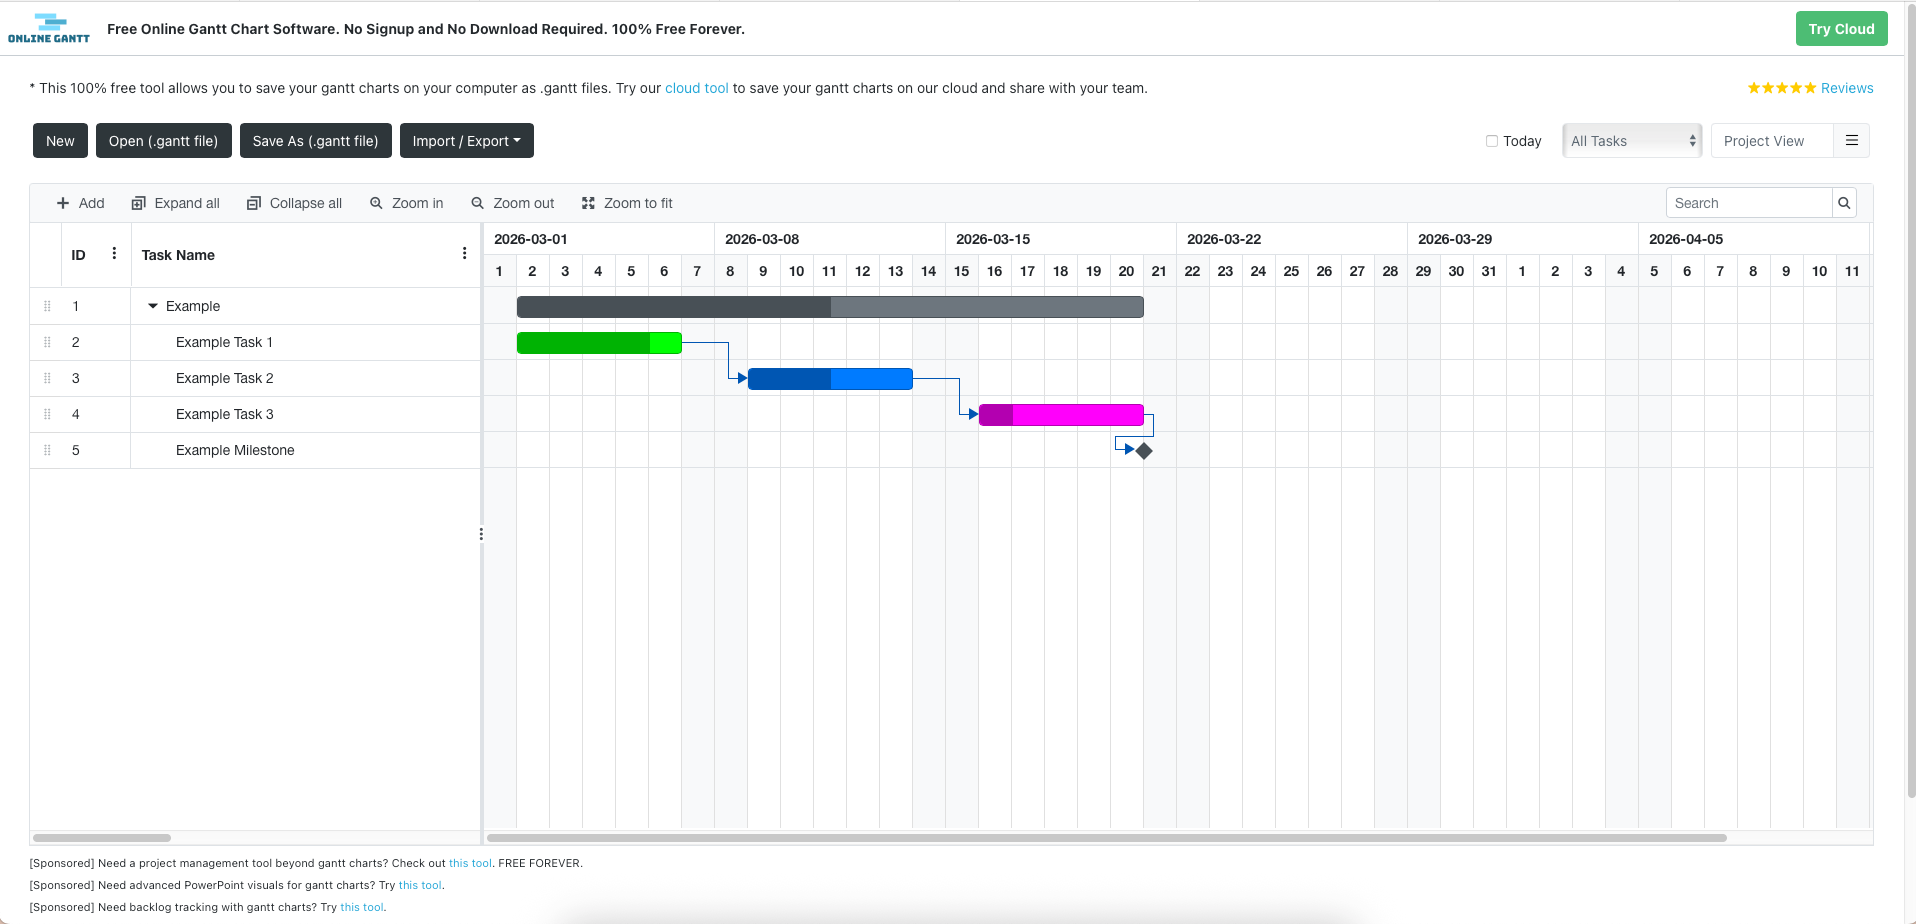
With this information prepared, the actual chart can be constructed. Traditionally, Gantt charts were drawn by hand on paper with a horizontal time axis and a vertical task list. Today, digital tools have made the process much easier and more dynamic. Spreadsheet programs such as Microsoft Excel allow users to create Gantt charts using stacked bar charts and conditional formatting.
Dedicated project management software like Microsoft Project offers advanced features, including automatic dependency linking, progress tracking, and resource management. Online platforms such as Asana and Trello also provide timeline or Gantt-style views that are easy to update and share with teams. These tools automatically adjust the schedule when tasks are moved, making them especially useful for complex projects.
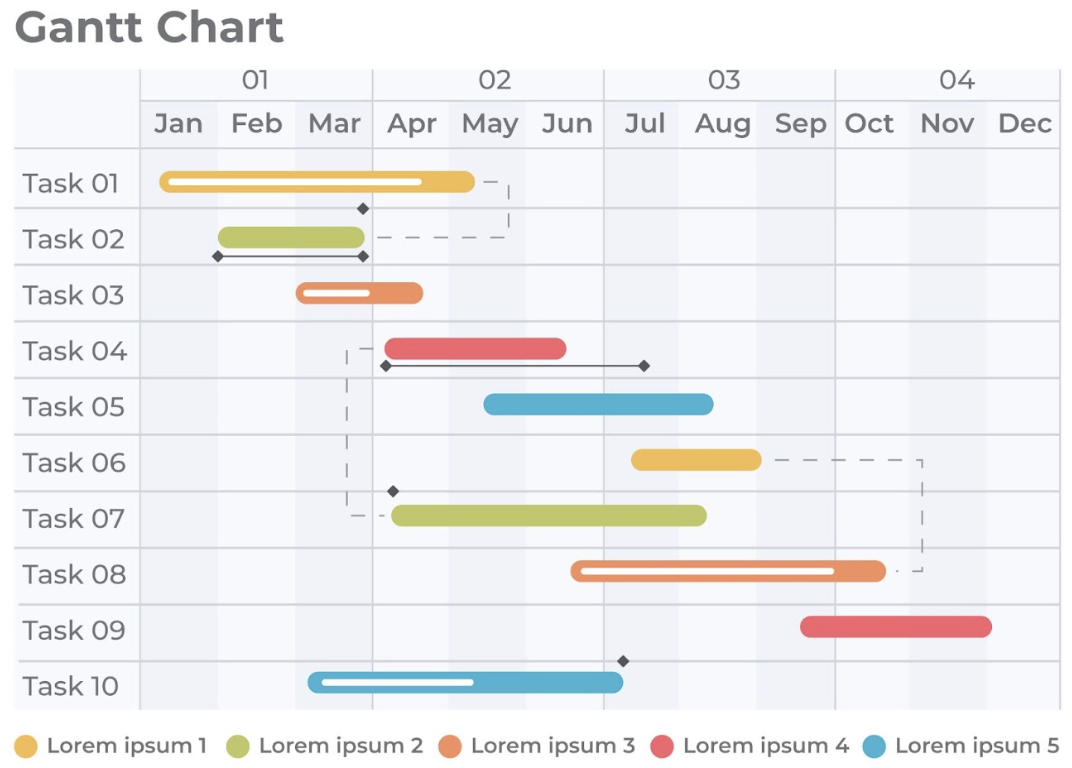
When designing the chart, it is important to maintain clarity. Each task should be represented by a horizontal bar whose length corresponds to its duration. Milestones, which are significant points or achievements in the project, can be marked with special symbols. Color coding is often used to differentiate task categories or indicate status, such as completed, in progress, or delayed.
A well-designed Gantt chart should be easy to read at a glance, allowing viewers to understand the project timeline without confusion. Overloading the chart with too many minor tasks can reduce its effectiveness, so maintaining a balance between detail and simplicity is crucial.
In conclusion, a Gantt chart is a powerful and practical tool for organizing and managing projects of any size. By visually representing tasks along a timeline, it enhances planning, coordination, and progress tracking. From its origins with Henry Gantt to its modern digital implementations, the chart remains a cornerstone of effective project management.
Learning how to create and use a Gantt chart not only improves organizational skills but also increases the likelihood of completing projects on time and within scope. Whether created manually or with specialized software, a well-constructed Gantt chart transforms complex projects into structured, manageable plans that guide teams toward successful completion.