Data Analytics Roadmap for Beginners
Before moving to advanced tools, it is important to become comfortable with spreadsheets, formulas, sorting, filtering, and basic charts, since these skills help you understand how data is arranged and how it can be managed effectively.

Data analytics is one of the most useful and fast-growing fields today. Every company collects data, but that data becomes valuable only when it is understood and used properly.
For students and beginners, data analytics may seem difficult at first because it involves tools, technical skills, and problem-solving. However, if you learn it step by step, the journey becomes much easier. This article explains the roadmap in detail so beginners can understand where to start and how to move forward.
Understand the basics with Excel
The first step in learning data analytics is to understand the basics using Microsoft Excel. Excel is a simple and beginner-friendly tool that helps you organize, clean, and analyze data. It is widely used in offices, schools, and companies, which makes it an excellent starting point. Before moving to advanced tools, it is important to become comfortable with spreadsheets, formulas, sorting, filtering, and basic charts, since these skills help you understand how data is arranged and how it can be managed effectively.
Excel also teaches you how to think logically about data. Suppose you have a list of students' marks. With Excel, you can calculate averages, find the highest and lowest scores, and create a chart to compare results in just a few clicks. This kind of practice builds confidence and prepares you for more advanced analytics work later. A strong foundation in Excel makes every step that follows much easier.

Learn SQL to work with databases
After Excel, the next important skill is SQL, which stands for Structured Query Language. SQL is used to communicate with databases and retrieve information from them. In real companies, large amounts of data are stored in databases, and analysts rely on SQL to access exactly what they need. This makes it one of the most important skills in data analytics.
With SQL, you can filter data, sort it, combine tables, and find specific information quickly. If a company wants to know its total sales for a particular month, for instance, SQL can pull that information directly from a database within seconds. Beyond the technical skill itself, learning SQL sharpens your ability to solve problems, since it trains you to ask the right questions about data. Because many job interviews include SQL questions, mastering this skill early is essential for beginners entering the field.
Start learning Python for data analysis
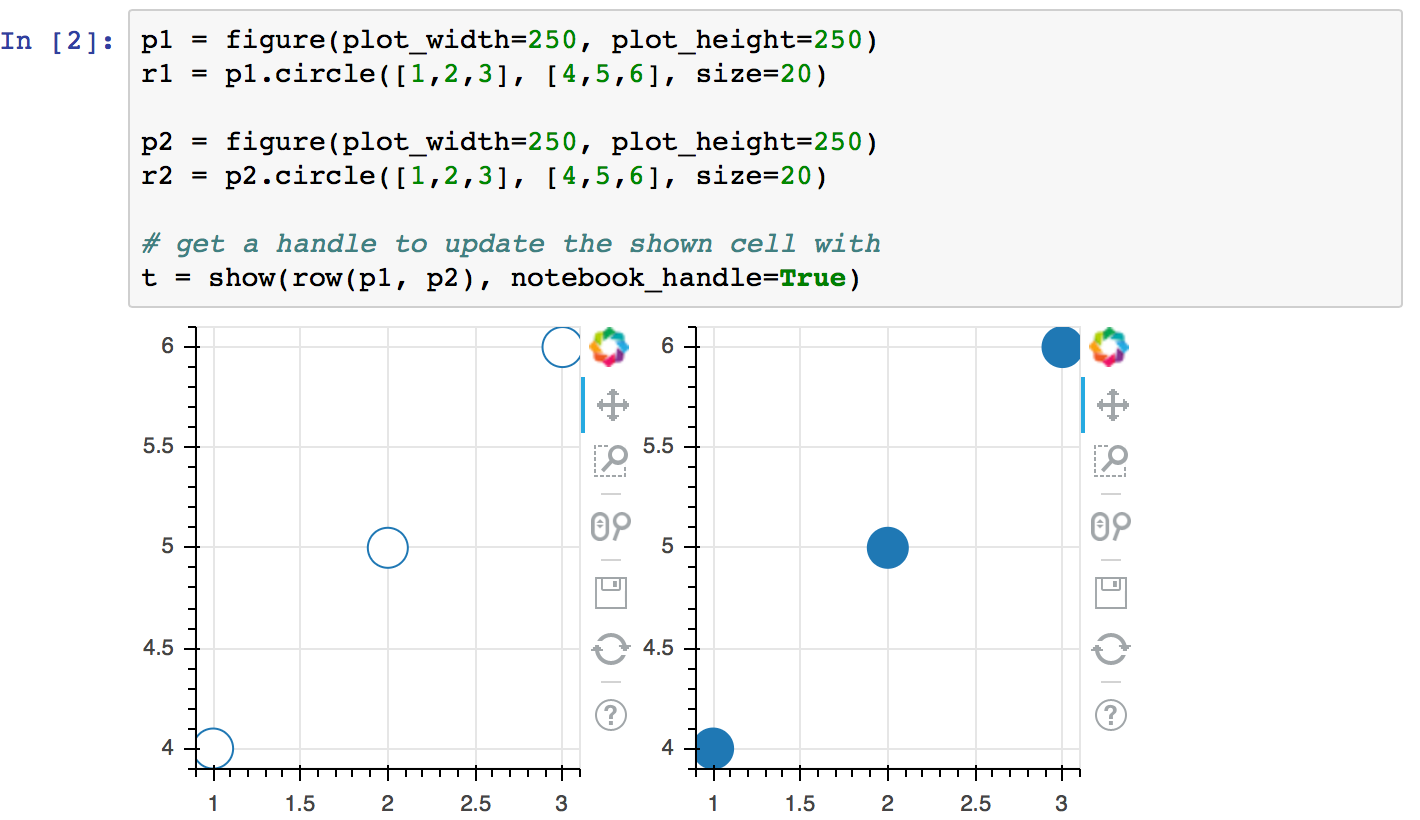
Once you understand Excel and SQL, the next step is to learn Python. Python is a programming language that makes data analysis faster, easier, and more powerful, especially when working with large datasets or repeated tasks. It allows analysts to clean data, automate work, create graphs, and perform advanced analysis in a structured way that spreadsheets simply cannot match.
Two libraries are especially useful for beginners: Pandas, which handles and analyzes data, and Matplotlib, which creates charts and visualizations. Picture a dataset with thousands of rows of sales figures. Python can clean it, calculate totals, and reveal trends over time in a fraction of the time it would take manually. Learning Python does take patience, but it quickly becomes rewarding once you start applying it to real data projects.
Practice data visualization tools
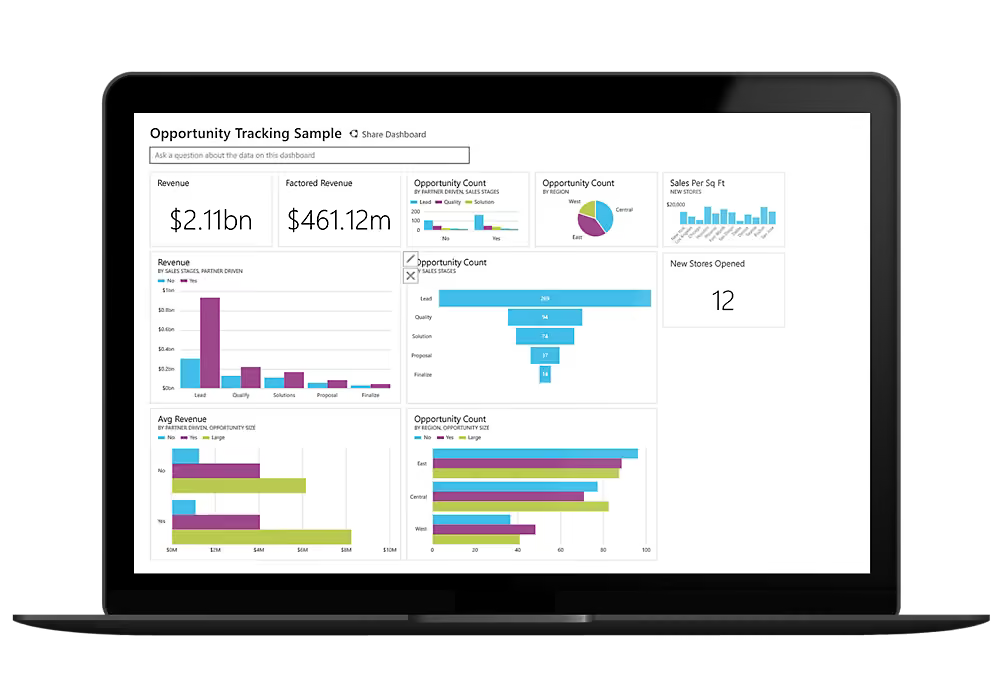
Data visualization is another key part of the roadmap. Tools like Power BI and Tableau turn raw data into charts, graphs, and dashboards that are easy to understand briefly. Visualization matters because most people don't want to sift through long tables of numbers. They prefer simple visuals that clearly show trends, comparisons, and patterns.
A dashboard, for example, can display monthly sales, customer growth, and product performance all in one place, helping business managers make decisions quickly and confidently. As a data analyst, your job isn’t just to analyze numbers. It's to present them in a way that others can act on. Learning visualization tools sharpens your communication skills and gives your analysis a more professional edge, since a well-designed chart can often explain a message better than a paragraph of text.
Build statistical understanding
Statistics is the next major step in data analytics. It helps you understand data more deeply and draw accurate conclusions instead of surface-level observations. Basic concepts such as averages, percentages, correlation, variation, and probability form the backbone of good analysis. Without them, it's easy to misread a chart or reach the wrong conclusion from a report.
If sales rise one month, for example, statistics help you determine whether that increase is meaningful or simply normal fluctuation. It also allows you to compare groups, spot patterns, and measure relationships between variables, giving real meaning to raw numbers. You don't need to be a math expert to benefit from this step; even a working knowledge of basic statistics will noticeably sharpen your analysis and judgment.
Work on projects and build a portfolio
The final and most practical step is to apply everything you've learned through real projects. Genuine learning happens when you put Excel, SQL, Python, visualization, and statistics to work together on actual data, not just in theory. Start small: student marks, sales records, or public datasets available online all make excellent practice material.
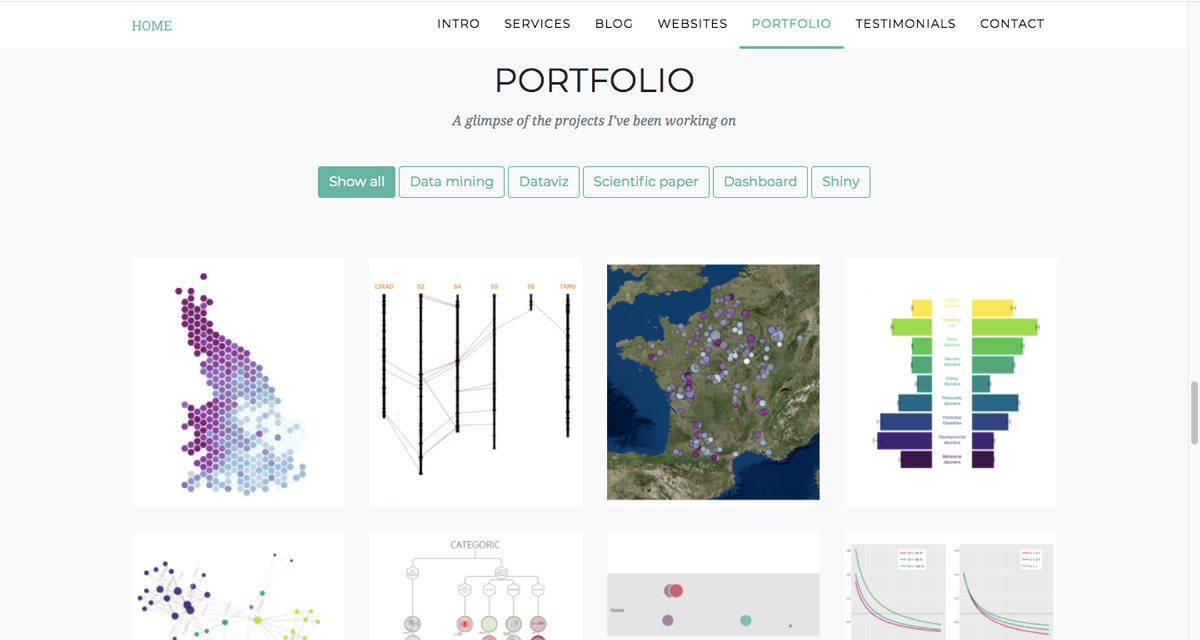
A portfolio is simply a collection of this work, and it matters because employers want to see what you can actually do, not just what you've studied. Even simple projects leave a strong impression when they're clear, well organized, and clearly explained. Dashboards, reports, charts, or short case studies all work well. As you keep practicing and building, your confidence will grow alongside your chances of getting hired.
CONCLUSION
Learning data analytics becomes far easier when you follow a step-by-step roadmap. Start with Excel, then move to SQL, Python, visualization tools, and statistics, before shifting your focus to real projects and a strong portfolio. Each step builds on the last, adding a new layer of knowledge that prepares you for the next one. The tools may seem like a lot at first, but they don't need to be learned overnight. What matters most is consistency. Start with one step today, keep practicing, and you'll steadily build the skills needed for a successful career in data analytics.